

That you sought to understand the rotation between Bitcoin and altcoins or better predicting large crypto cycles,Altcoin Season Index remains one of the most popular tools to help you navigate. Think to clarify the overall reading of the market, it makes visible the times when the altcoins are required, while drawing attention to the classic pitfalls to avoid before reviewing your digital investment strategy.
Altcoin Season Index – the indicator that reveals when altcoins take over
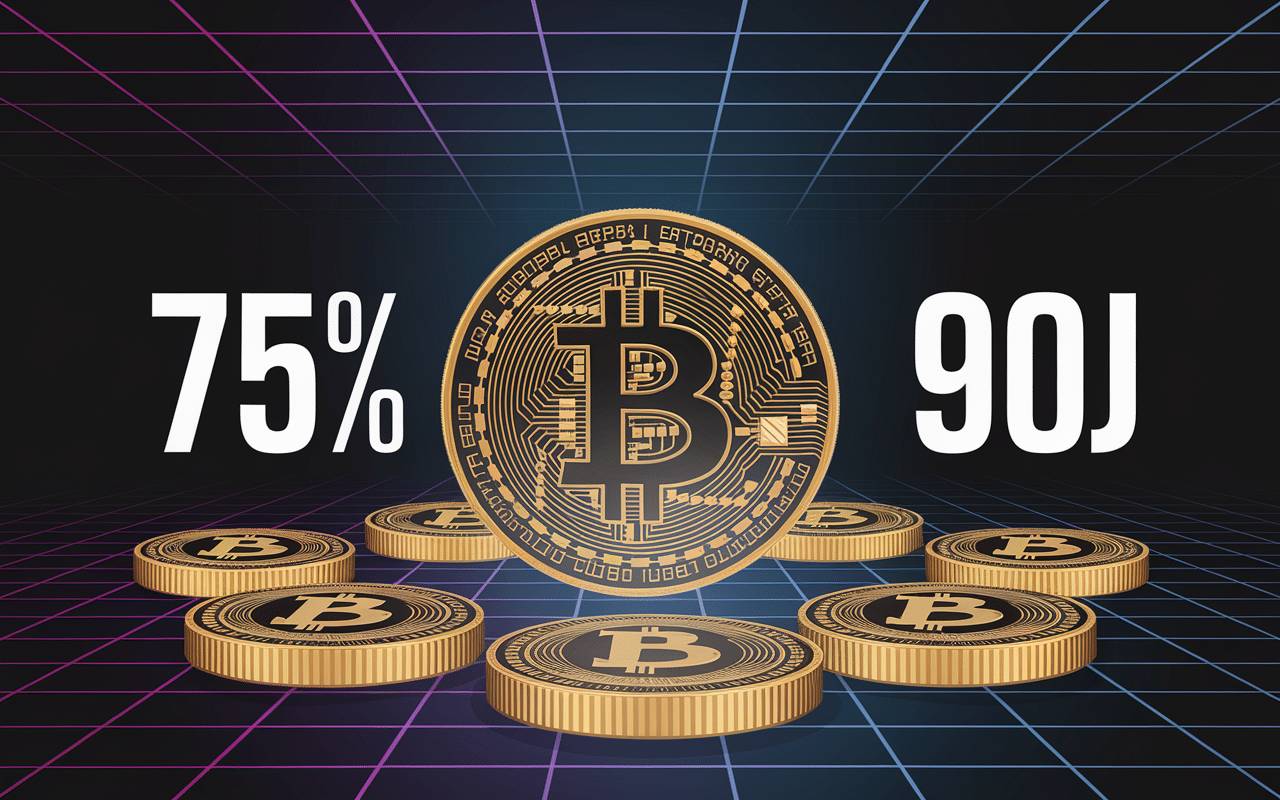
Many question: does there really exist a signal to understand when the altcoins pass before Bitcoin? At this point in time, the Altcoin Season Index is required. Designed to make detection of large cycles more accessible, this indicator, likes analysts as amateurs, calculates the percentage of the main altcoins that exceed Bitcoin over the last 90 days. As long as the index crosses the key threshold of 75the famous « altcoin season » officially starts.
On the other hand, a score of less than 25 translates « Bitcoin season », with most of the capital going to Bitcoin. Following the Altcoin Season Index then makes it possible to distinguish (at a glance warned) the best windows to expose to altcoins. But its methodology needs to be studied and its limits noted to secure its arbitrations. A specialist trainer recently pointed out that the lack of knowledge of parameters regularly leads to avoidable disappointments.
What is the Altcoin Season Index?
This tool cannot be properly ignored when one is interested in the most dynamic cryptos. The Altcoin Season Index or « Altcoin season index » measures the fraction of altcoins (excluding stablecoins) that have overperformed Bitcoin over the last 90 days. As soon as 75% of the top 50 altcoins exceed the BTC, the signal is clear: the season of the altcoins is full.
In the spring of 2021, the index crossed this threshold, with more than 80 % of the main altcoins in the lead, starting an exceptional rally. Note: the stablecoins and backed tokens, whose value remains constant, have come out of the calculation to better stick to the speculative reality of the market. Former investors recall underestimating this aspect and having reported, too late, its importance on the performance curve.
Why watch this index – a timing issue
Identifying the phases of capital turnover between Bitcoin and Altcoins is to maximize its chances of acting at the best time. This avoids misunderstandings. The Altcoin Season Index behaves as a reliable benchmark provided that it goes beyond the displayed figure.
Three aspects give it a singular character:
- Immediate reading It is sufficient to monitor a significant threshold, that of the 75, to detect acceleration on the altcoins side.
- Representative range : the calculation includes between 50 and 100 major cryptos, thus reducing the influence of a single project overflying.
- 90-day perspective : study this window allows to temper the impact of isolated episodes too short.
Who hasn't felt this regret of arriving on a bullish rally while he was out of breath? The Altcoin Season Index, well exploited, helps detect the collective wave and avoid entering... too late. A professional recently agreed that a careful reading of the timing allowed him to limit his false scores on two consecutive cycles.
How does the Altcoin Season Index work? Method of calculation and key thresholds
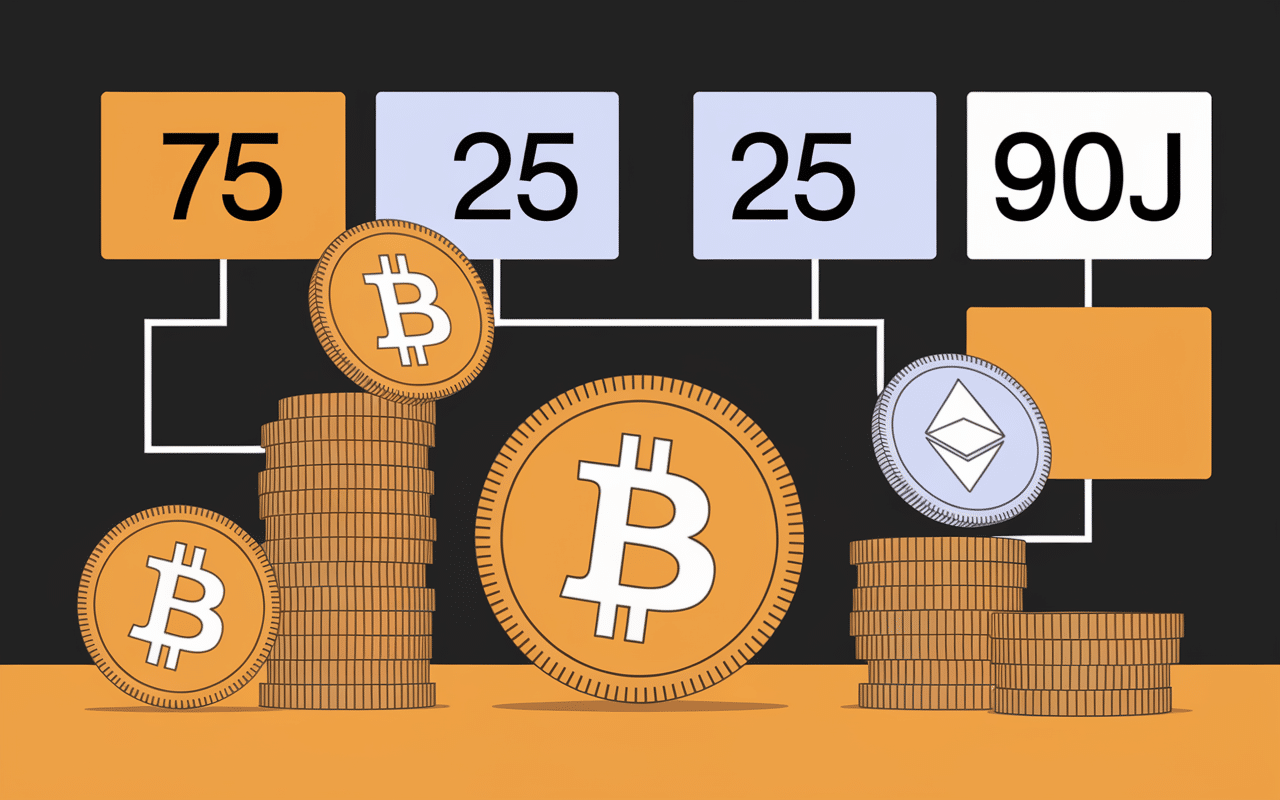
The principle remains clear: over the last 90 days, if 75% (38 out of 50) main altcoins do better than Bitcoin, the season of the altcoins begins. Below 25%, Bitcoin returns the predominant actor this kind of threshold often creates the event with experienced analysts.
The standard calculation is based on a simple basis:
- Panel selected: 50 to 100 altcoinsthe largest, without stable corners.
- Cumulative Daily Performance vs. Bitcoin, continuously updated.
- Reference thresholds: 75 on the index for altcoin season, 25 for Bitcoin season.
There are variations according to the suppliers of indices (the Blockchaincenter tool, for example, refines the selection from time to time), but the idea remains constant: to propose an overall vision on the collective energy of the altcoins.
Realization (example 2021):
Illustrating by 2021: As Bitcoin progressed by about 2% over 90 days, some altcoins showed flights beyond the +174 %. As a result, the index remained in the altcoin season area for almost 17 days in a row, a rare situation indicating the magnitude of the rotation observed.
| Season | Threshold Index | Average duration observed |
|---|---|---|
| Altcoin Season | > 75 | 17 days (max: 117 days) |
| Bitcoin Season | < 25 | 10 days (max: 126 days) |
What is the Altcoin Season Index for in an investment strategy?
Do you feel the desire to strengthen your altcoins as soon as the market rustles with rumors? The Altcoin Season Index puts a structure on your decision making, limits emotional biases and helps to distribute capital with a certain distance during intense phases.
Prevent FOMO and adjust exposure
How many buy their altcoins on a summit, carried away by euphoria? The index offers a quick reading of the climate before taking action. When the symbolic bar of the 75s approaches (and as Bitcoin dominance bows, for example from 65% to 40%), collective changeover becomes probable.
Some effective benchmarks to rest calmly on the indicator:
- Check the duration of the trend over 2 to 3 weeks (a single peak is not enough).
- Analyze exchange volumes on major platforms, a volume of over USD 98 billion/24h attracts the eye of retailers.
- Watch Bitcoin dominance : if it falls, the migration of flows to the altcoins is often confirmed.
A humorous trait circulates among some analysts: during the last great altseason, the number of cryptocurrency recorded blazed, apparently exceeding, 28 millionHey! This figure, although carefully handled, illustrates the possible frenzy sometimes synonymous with overconfidence among newcomers.
What are the tools to follow the Altcoin Season Index in real time?
Instead of accumulating risky spreadsheets, most enthusiasts prefer to use continuously updated dashboards. Access to these visual interfaces is known to reduce approximations and improve decision making.
Dashboards and simulators within click
Some reference platforms allow you to view the index live:
- Daily updated dashboards For example, Blockchaincenter
- In-depth analyses on Smithii.io or via Cointribute TradingView
- User-side simulators : practices for assessing the effect of a new distribution on varied historical
Also remember to set up custom alerts: they report exceeding the critical threshold according to your own criteria. Some argue that this simple step has avoided more of a risky arbitration in a sudden sudden market crash.
Compare the Altcoin Season Index to Bitcoin dominance and other indicators
Based on a single indicator, it exposes to errors of perspective. The intersection of several bitcoin dominance measures (the BTC's share in global capitalization) and market volumes offers a much stronger diagnosis. Some experts also recommend monitoring these « intersections », frequently warning of major reversals during the major phases of altcoins.
Dominance, volatility and advanced signals
At the last intense cycle, Bitcoin dominance fell from 65% to 40% : a rocking followed by a real boom on the Altcoins side. That said, to refine your input or output decisions, complementary signals such as RSI (relative strength index) or Bollinger bands remain valuable. A consultant recently mentioned having coupled these metrics to the index to gain safety in volatile phases.
Keep in mind: the Altcoin Season Index sets the tone together, but does not prejudge the individual success of the Altcoin. Even during the most spectacular cycles, many projects do not take off or step back, sometimes without warning. Isn't it the uncertainty that is an integral part of the game in this market?
Risks, limitations and frequent errors: what should not be overlooked
Regularly, the pitfalls encountered by newcomers come from too fast a reading of signals, or from overoptimism during volatility access. On the Altcoin Season Index, several « traps » As a community of investors recalled in a recent online workshop:
To better understand market movements, it is essential to master the basics of the crypto bubbles: understand speculative bubbles and visualize the market.
To maximize your investments during the Altcoins season, explore our in-depth analysis of Which crypt will explode in 2025 and identify the best opportunities.
To refine your strategy during the season of Altcoins, using tools like lStochastic momentum index SMI: the advanced tool to refine your technical analysis can be valuable in better interpreting market movements.
Traps to avoid and emotional management
The FOMO (fear to miss the occasion) is the pitfall par excellence. It pushes to intervene on a temporary basis and neglect traditional safeguards (stop-loss, risk management rules). We must also be wary of the illusion that an altcoin season would be endless: in reality, the average is only 17 days About consecutive!
It's best to stick to a few essential safeguards:
- N, even in euphoric market sequences.
- Record your positions and performance : keeping track helps to step back from the ambient tumult.
- Stay tuned to macroeconomic/sectoral announcements They often lead to unexpected turns.
True story, shared during a webinar: in 2021, the longest altseason lasted 117 days... and the shortest, just 2 days. What relativizes all established certainties!
Summary table: main thresholds, duration and historical performance
| Period | Altcoin Threshold Index | Btc Dominance | Altcoins performance | Duration |
|---|---|---|---|---|
| 2021 (light example) | 85 | 40% | +174% (over 90 days) | 17 days |
| Intermediate cycle | 60-75 | 45-55% | +30 % to +80 % | 5 to 15 days |
| Bitcoin season | < 25 | 60%+ | BTC overperformance altcoins | 10 days (max: 126 days) |
Practical checklist & FAQ: integrate Altcoin Season Index safely
Before any portfolio adjustment, some questions come back tirelessly. This toolbox offers a brief overview to exploit the index while limiting classic errors.
Quick checklist to keep in hand
- Does the index hold above 75 for a few days? Is this a sign of persistent collective strength?
- Does Bitcoin dominance recede simultaneously?
- Do the quantities exchanged on the altcoins exceed the usual averages?
- Does your portfolio remain protected against the risk of overflight?
- Do you have a reliable and up-to-date dashboard to monitor daily?
A little advice gleaned from a discussion between traders: regularly validate your feelings using a simulator or live dashboard. This has saved many impulsive decisions to more than one experienced investor...
FAQ: your questions, my clear answers
1. What difference between Altcoin Season Index and Bitcoin dominance?
The index compares the performance of the altcoins to that of Bitcoin, while the BTC dominance refers to its relative share in the total cap market. Both offer a complementary perspective to anticipate a possible flow shift.
2. Does every altcoin enjoy the season?
Not constantly. Even in a general package, some altcoins stagnate or retreat. It is better to focus on assets that are already well-orientated than on market chance.
3. Can we rely solely on the index to invest?
No, it is a collective atmosphere barometer, not an individual action plan. It is strongly recommended that it be crossed with other risk management tools or indicators.
4. What is the average duration of an altcoin season?
Count on average about 17 days, but with significant differences some cycles extend over more than 100 days, others expire within a week.
5. Where to follow the indicator continuously?
Sites Blockchaincenter or Smithii.io are among the popular platforms, with daily updates and a clear interface.
To make further progress, download a detailed guide without hesitation, set up automatic alerts or participate in a webinar: everything that helps to strengthen your expertise in this complex and stimulating universe where each season reserves (almost always) its lot of surprises.