


The speculative bubbles in the universe of cryptocurrency fascinates as much as they worry investors. These phenomena of exponential rise followed by a sharp fall in prices regularly mark cryptic news. Understanding the mechanisms of a crypto bubble and knowing how to use market visualization tools becomes essential to navigating this volatile environment.
What is a crypto bubble and how to recognize it
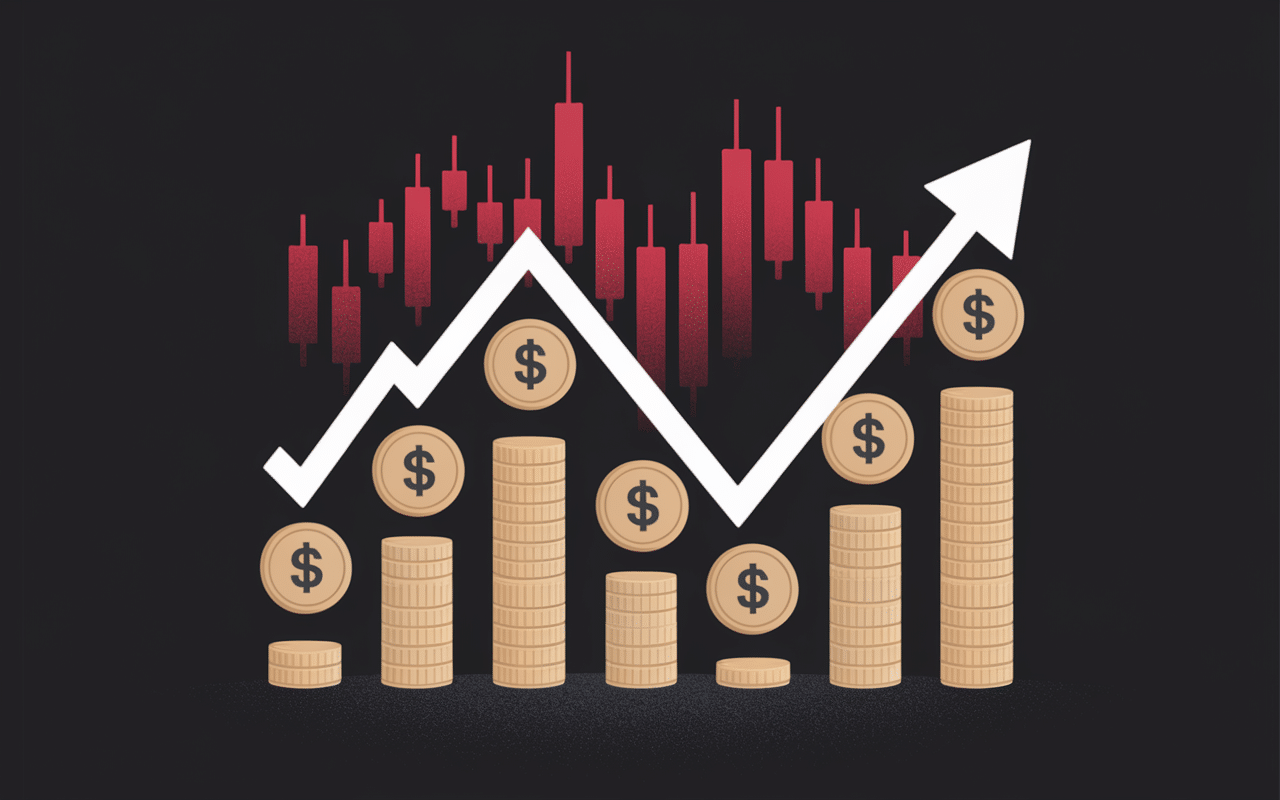
One cryptobbble means a period when the prices of cryptocurrency increase in an irrational and unsustainable manner, disconnected from their fundamental value. This phenomenon results from excessive speculation fuelled by collective euphoria of investors.
The characteristic signs of a crypto bubble include a rapid price rise over a short period, often above 1000% in a few months. The Fear of Missing Out (FOMO) then pushes novice investors to buy massively, creating artificial market adoption. Mainstream media is beginning to intensively cover cryptocurrency, and discussions about Bitcoin or thetherem are invading social networks.
Recent history has two particularly striking major bubbles:
- The 2017 bubble : Bitcoin reached nearly $20,000 in December before falling to $3,200 in 2018
- The bubble of 2021 : Historical peak at $69,000 followed by massive correction up to $15,500 in 2022
These cycles usually follow four distinct phases: silent accumulation, euphoric climb, speculative peak and brutal correction. Psychological mechanisms involve collective greed that replaces rationality, creating a vicious circle of compulsive purchasing.
Crypto Bubbles: real-time market visualization tool

Tool Crypto Bubbles revolutionizes the way the cryptocurrency market is analyzed through its intuitive visual representation. This platform transforms complex market data into colorful bubbles that are easily interpreted by all investors.
The operation is based on a bubble system whose size corresponds to the market capitalization of each cryptocurrency. The bigger the bubble, the larger the capitalization. This representation quickly identifies the dominant assets of the crypto market.
Color interpretation follows a simple but effective code:
| Colour | Meaning | Performance |
|---|---|---|
| Light green to dark green | Increase | +1% to +50% and more |
| Light to dark red | Down | -1% to -50% and less |
| Grey | Stable | Change close to 0% |
Navigation offers several advanced filtering options. Users can select different analysis periods (1h, 24h, 7d, 30d), screen for market capitalization or search for specific cryptocurrency. This flexibility makes it possible to adapt the analysis to the desired investment strategies and time horizons.
The token Bubble (BUB): analysis and market data
The token Bubble (BUB) represents an interesting case study in the universe of alternative cryptocurrency. With current price of 0.0009065 €, this token now ranks #6215 in the crypto market, reflecting its marginal position in the ecosystem.
The total supply limited to 768.75K BUB gives theoretical rarity to the token. However, the Fully Diluted Valuation (FDV) of only 696.87 € illustrates the current low market value of the project.
Historical analysis reveals a particularly volatile trajectory. The token reached its highest historical (ATH) at 0,4028 € in September 2017, corresponding to the general euphoria of the crypto market. Conversely, its lowest (ATL) was 0.00008943 € in December 2015, marking an extended bear market period.
The current performance shows a drastic decrease of 99.77% from the highest historical level. This drop perfectly illustrates the risks associated with altcoins during the correction phases following a crypto bubble. This reflects the common fate of many tokens issued during periods of speculative euphoria.
To anticipate market cycles and avoid the pitfalls of a crypto bubble, tool Altcoin Season Index: Understanding, anticipating and exploiting the Altcoin season can be valuable.
In order to better anticipate market fluctuations and avoid the pitfalls of speculative bubbles, it is crucial to understand cryptocurrency and invest calmly.
To analyze market trends and anticipate speculative bubbles, explore detailed data from RLUSD: Real-time price, tools and analysis around stablecoin Ripple USD.
Strategies for investing during crypto bubbles
Investing during a crypto bubble requires a methodical approach combining technical analysis and rigorous emotional management. Early identification of opportunities is based on several key indicators: unusual exchange volume, growing media coverage and massive influx of new investors.
The Dollar Cost Averaging (DCA) is particularly effective in these volatile environments. This strategy consists of investing fixed amounts at regular intervals, thus smoothing the impact of extreme volatility. Automatic stop-loses protect against sudden falls, limiting losses to predefined levels.
Diversification becomes crucial during crypto bubbles. Divide investment between several cryptocurrency categories (Bitcoin, Ethereum, altcoins, DeFi tokens) reduces exposure to the specific risks of each asset. This approach reduces the impact of a possible sectoral collapse.
The warning signals of a bubble about to burst include:
- Widespread euphoria of mainstream media
- Mass influx of inexperienced investors
- Total price and actual utility disconnect
- Multiplication of substanceless projects
Exit strategies must be planned prior to investment. Setting phased profit-taking targets (25%, 50%, 75%) makes it possible to progressively secure earnings. This discipline avoids the complete brutal corrections that characterize the end of cryptobbles.
Navigate intelligently in the cryptobble universe
Understanding crypto bubbles and using visualization tools like Crypto Bubbles are essential assets for any cryptocurrency investor. These cyclical phenomena will probably continue to mark the evolution of the crypto market, making an educated and disciplined approach indispensable. The key to success lies in the balance between opportunity and prudence, always keeping in mind that behind each speculative bubble there is an inevitable correction.