
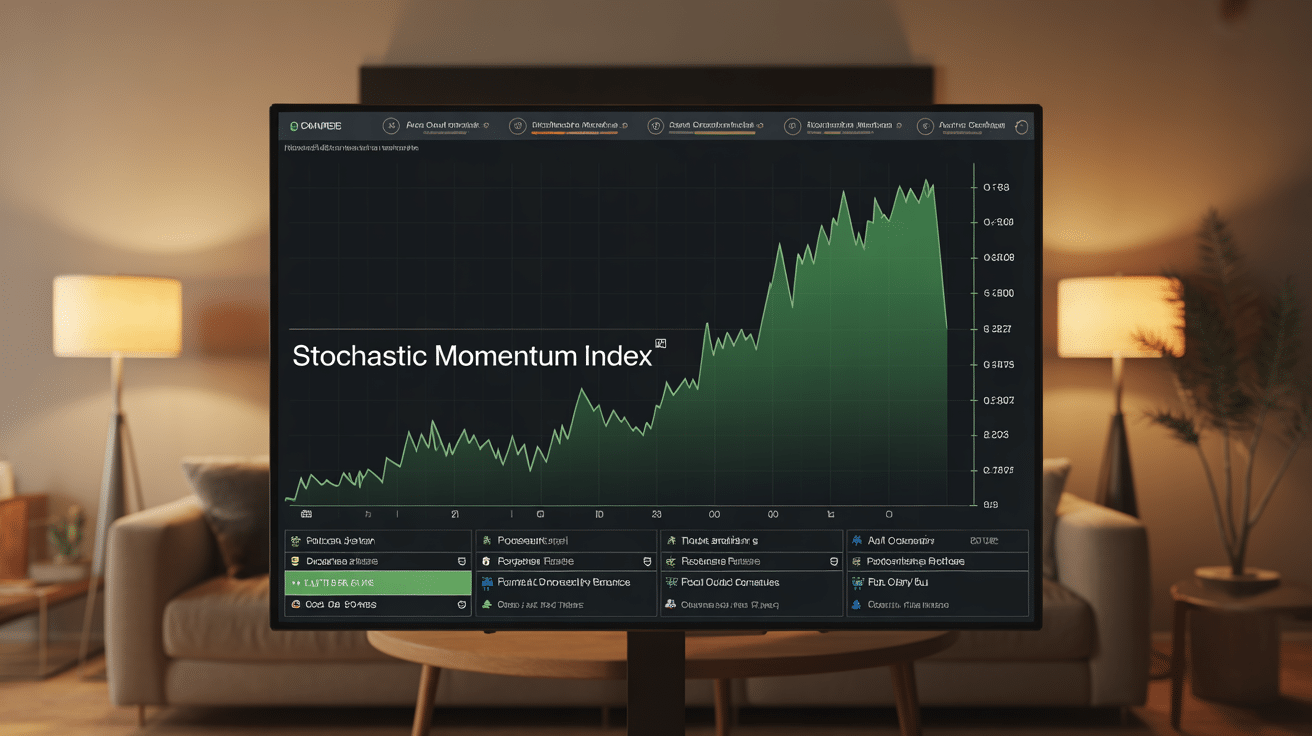

The Stochastic Momentum Index is a key partner for those who aim to advance in trading while avoiding getting lost in too technical details: relying on a rigorous but clear indicator helps to illuminate the reading of the momentum In order to achieve greater autonomy and confidence in its decision-making, the Commission should:
Stochastic Momentum Index (SMI) – understand, configure and interpret this key indicator of modern trading
Do you want to build up your trading signals, reduce market noise and act in a truly enlightened way? The Stochastic Momentum Index (SMI), developed by William Blau, was created to allow you to refine momentum analysis. In a short period of time, we understand how this oscillator, relying on a clever formula and adapted thresholds (+40/-40 on a scale of -100 to +100), goes beyond classical stochastics, while remaining intuitive and flexible according to each trader profile.
SMI, RSI, stochastic... It is not uncommon to lose it. But once the SMI is well grasped, we regain control of its risk management and gain in serenity in execution. To illustrate the difference: some traders tell how a move to the IMS has enabled them to avoid several false alerts in a row, where they previously allowed opportunities. A trainer recently mentioned that recognizing the structure of this indicator had changed the management of stop-losses. Unsurprisingly, "taking the thread" of the momentum is relatively often regaining confidence in his choices.
Summary of key points
- ✅ The IMS helps to better read market momentum by reducing false signals.
- ✅ This oscillator is more nuanced than the classic stochastic, with a scale of -100 to +100 and adapted thresholds.
- ✅ IMS control improves risk management and confidence in decision-making.
What is the IMS? Background and particularities
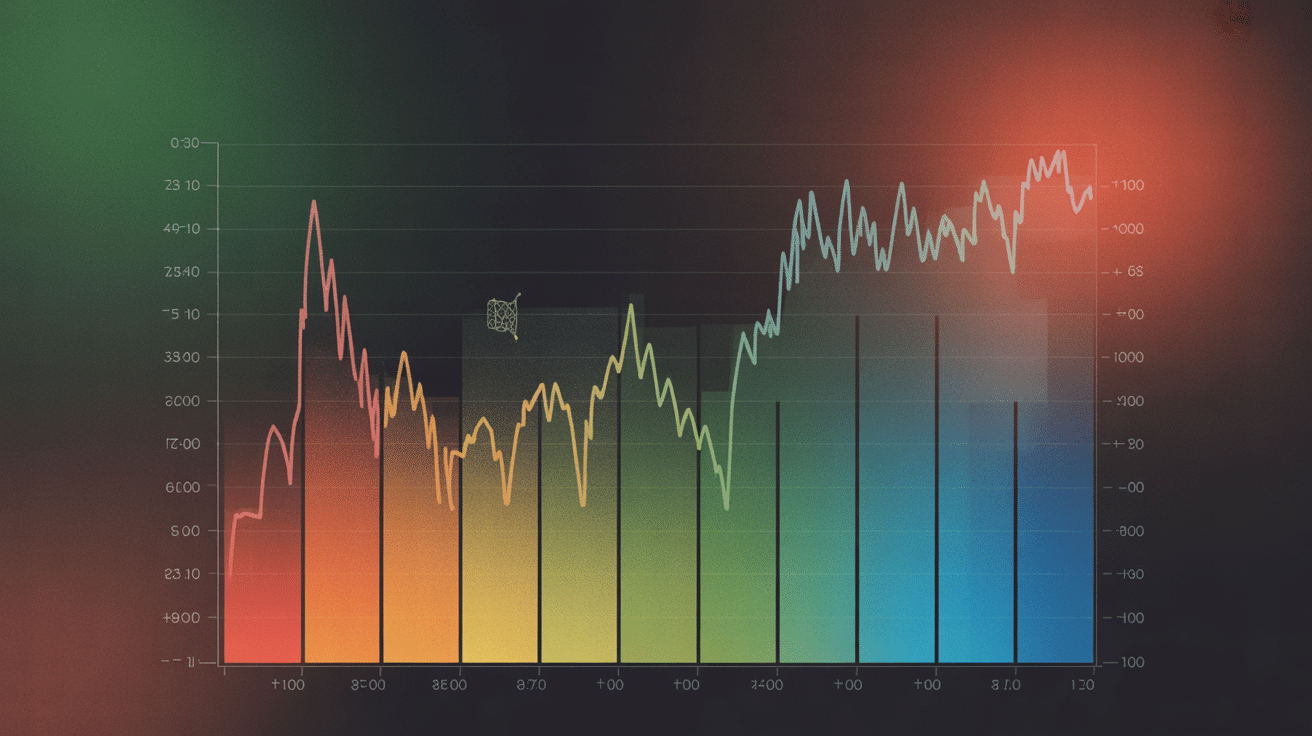
The Stochastic Momentum Index (SMI) was born out of the imagination of over-purchase/over-sale indicator. William Blau The idea was to offer a more nuanced and robust version of George Lane's stochastics. The particularity of the IMS? It evaluates the momentum after the position of the closing course relative to the center of the range (the middle zone), not its extremes, which gives it a better reactivity... while limiting the effects of isolated peaks.
While the classic version displays 80/20 alerts, the SMI operates on a range of -100 to +100, with precautionary thresholds at +40 and -40. This more measured approach makes it possible to report an overheating market or a truly significant reversal potential.
But what is the interest in choosing the SMI rather than another oscillator? It can be seen fairly regularly that by filtering the parasite signals better, it helps traders to focus on what really matters (some professionals insist on this during training sessions). It is not uncommon, in a turbulent or "lined" market, to see an IMS highlight opportunities where other indicators are wrong. Who never felt this frustration of a false signal missing the reality of the market?
A logical evolution of technical analysis
The shift from traditional stochastics to SMI reflects an ongoing quest for more efficient tools in the face of the growing complexity of markets. Thanks to the double smoothing (EMA) and the focus on the central area of the range, the SMI collects the small price changes much better and is relevant during the "flat" periods. This progression resembles what some call the "learning curve", with an increasingly fine indicator.
This refinement is frequently emphasized by market participants: being both accurate and simple to take in hand is what many individual traders are looking for to move forward, in confidence, step after step. Besides, how many beginners admit to having gained insurance since they opted for the SMI as the first graphic benchmark?
Good to know
I recommend that you focus on SMI when looking for an indicator that is both accurate and easy to use, particularly useful for beginner traders or those looking for clarity in the face of market complexity.
How to calculate the SMI and configure its parameters?
Faced with the jargon of formulas, some feel an embarrassment... However, understanding how the IMS is calculated also means giving itself the opportunity to adapt to its own approach. To anchor the method, we can rely on a few concrete examples: a professional recently reported that once the calculation steps were understood, setting the parameters took only a few minutes, even on new assets.
Formula aside: a handful of steps
In practice, the IMS formula reads as follows:
- First determine the centre of range (higher + lower) / 2, on N periods (often 14 Standard).
- Then measure the distance between the fence yard and this centre: Fence – center of range.
- Then apply a double exponential smoothing (EMA) on the distance and on half of the range above, using generally 3 then 5 periods.
- Finally calculate the SMI = 100 x (EMA2[closure-centre]) / (EMA2[half of the range]), the score obtained always oscillating between -100 and +100.
To view: over 14 days, if the price varies between 100 and 110, with a fence at 108, the center of the range will be 105. Distance to this centre: 108-105=3. Once the double EMA is applied, a less "brute" SMI is obtained, both fluid and reactive (more than one trainer explains that this is where the difference in readability appears, especially for non-mathematicians!).
Recommended settings in practice
The following settings are regularly used to adapt the SMI to its trading:
| Parameter | Current value |
|---|---|
| Period of calculation (N) | 14 |
| EMA 1 smoothing | 3 |
| EMA 2 smoothing | 5 |
| Over-purchase threshold | +40 |
| Oversale threshold | -40 |
For scalping, experienced users sometimes prefer to shorten the period to 7-10; For swing trading, it is common to stay on 14, or extend up to 21 for highly volatile markets. Most platforms integrate these parameters directly and greatly facilitate visual comparison, which remains very instructive (a coach often cites this increase in autonomy in the first trials).
Interpret IMS signals in practice
Once your settings are in place, how can you detect really exploitable signals? What makes the SMI an asset is to detect both extremes (over-purchase/over-sale), but also to offer, thanks to the crossovers and the combination with other tools, nuanced benchmarks. Sometimes a beginner user finds an unnoticed reversal on other indicators by combining these different "filters".
Crossings, thresholds and key signals to be monitored
In daily action, three situations deserve special attention:
- If IMS exceeds +40, one usually enters the over-purchase zone: this indicates a context where to monitor a possible reversal or consider taking its profits can prove wise.
- When SMI passes under -40, the oversales area gives hope (sometimes, but not always) for a technical rebound. It is preferable here to remain patient, because a false departure is always possible and can cost expensive...
- A cross between the SMI line (%K) and its signal line (%D, frequently EMA 3 or 5) becomes relevant, especially when it occurs in extreme areas. Several webinar speakers also point out how well filtered these crosses enabled them to adjust their timing of entry and exit.
To sum up, a fairly widespread strategy is to buy when the IMS crosses its signal upwards in the oversales zone, and to sell at a reverse crossing in the oversale zone. Many experts recommend, however, that these signals be validated with a fundamental trend (e.g. MM20), which avoids many misadventures. (As such, some traders say that excess precipitation is usually paid!)
Another crucial point: the neutral zone (from -40 to +40) usually concentrates the "noise" of the market; It is better to approach the SMI in hindsight, because looking for a signal at any price could lead to surtrading, which often does not bring anything good...
SMI vs Stochastic Classic vs RSI: Differences and Benefits
Selecting an oscillator often amounts to arbitrating between precision and robustness. The SMI draws its pin from the game especially in agitated markets, where stochastics generate a succession of false signals. Here is a comparison that sheds light on the main nuances:
| Criteria | SMI | Classic Stochastic | RSI |
|---|---|---|---|
| Scale | -100 to +100 | 0 to 100 | 0 to 100 |
| Overpurchase/oversale | +40/-40 | 80/20 | 70/30 |
| Sensitivity to extreme prices | Low | High | Average |
| Double smoothing EMA | Yes | No | No |
| Optimal use | Range or volatile markets | Clear trend | Confirmation of momentum |
In short, the SMI significantly reduces the sensitivity to short false progressions, which is a real advantage in unstable market periods (some experts stress this point in advanced trading workshops). On the other hand, if you are looking for a very reactive indicator for a stated trend, an ultra-short stochastic (5 or 7 periods) remains a relevant benchmark. As for the RSI, it still finds its place... as an additional filter or confirmation, depending on the style and position chosen.
Examples of integration on TradingView, MT4, ProRealTime: setting and display
Nothing is worth putting into practice. The current platforms (TradingView, MetaTrader 4/5, ProRealTime) offer almost all SMI, either natively or via community-shared scripts. Here's how to start with ease, even for a low-tech profile: besides, an expert would tell you that setting up the SMI on these tools often takes less than 2 minutes!
Basic Configuration on TradingView
On TradingView, enter "Stochastic Momentum Index" in the indicator search bar. Stay on the standard settings (14, 3, 5, 40, -40) to start, then eventually superimpose traditional stochastics to compare reactivity on your personal graphics.
To complete your technical analysis strategy with the Stochastic Momentum Index, it may be relevant to consult theAltcoin Season Index: Understanding, anticipating and exploiting the Altcoin season to better understand the cryptocurrency market cycles.
To master tools like the Stochastic Momentum Index and deepen your skills, explore this complete guide to understanding the basics of trading.
To maximize your trading performance, combine the Stochastic Momentum Index with the tips of the practical guide to exploiting performance over 12 slippery months.
To refine the approach, many traders add an alert on the SMI/%D crossing, particularly in the oversales area, in order to quickly spot the likely rebounds. This frees the mind and puts more rigour in keeping with the trading plan a fairly frequently heard return to regular users.
Zoom MT4 and ProRealTime
In MT4/MT5, the SMI indicator is classified with the other "Oscillators". Depending on the asset or timeframe chosen, consider adjusting the length of the main period (this limits the signals in excess, a rather classic trap cited by several stakeholders).
On ProRealTime, the SMI code can be added via the editor or retrieved from the community. We will also appreciate the flexible colours for over-purchase/over-sale, which simplify reading at a glance (a habit taken by many "visual" traders).
Limitations, precautions and good practices
No indicator, however effective, replaces vigilance. The IMS has its strengths, but requires some adjustments to avoid disappointment. In a market context, it seems that major announcements create signal "retards" even with double smoothing a trick: analysts recommend crossing the tools to neutralize this type of error.
Situations to avoid and the best filters
The SMI loses its relevance in highly directional markets: like other oscillators, it sometimes reports premature entries or outputs. In addition, during economic announcements, double smoothing can delay motor signals. This is why the importance of complementary filters is stressed. Better:
- Validating the IMS signals with a moving average or trend indicator, this severely limits the appearance of misleading signals at the beginning of the cyclical movement;
- Lightening the graphic display: only handle clearly confirmed signals, which encourages patience and reduces visual noise;
- Adapting the setting to the asset observe setting exchange when market conditions change, rather than staying blocked over the classic period of 14 (an adaptation that advanced traders quote as a real "game change").
Think also of backtesting on history, a real ally for "muscler" its SMI settings: most platforms offer this feature free of charge to test at leisure. Why not explore these tools now, to build your own experience capital?
Good to know
I strongly recommend that you associate the SMI with a trend indicator and use backtesting to optimize your settings for each asset, which significantly improves performance and limits false signals.
FAQ and practical resources to tame the IMS
Here are the questions that came back most frequently in coaching or webinars, punctuated with feedback and useful links because nothing replaces the practice on demo account!
Frequently asked questions and tips
- What difference between SMI and classical stochastics?
The IMS takes into account the position vis-à-vis the centre of the range, which makes it more robust, above all in uncertain phases or in low directional markets. - What are the best parameters for the IMS?
Standard settings: 14 (main period), 3 then 5 (smoothing EMA), thresholds +40/-40. For very volatile markets or scalping, you can test 7 or 10. - How can we limit false signals?
Filter the crossovers of the IMS using a graphic trend (MA20/50), overlay the support/resistance areas, or look at the volume side or even the ADX when markets panic.
Need to deepen or experiment? Here are some selected resources to launch or improve your settings:
- Complete SMI Guide on TrendSpider
- SMI Script and Tuto on TradingView
- Documentation SMI ThinkOrSwim
- Educational article in French
Want to go further? Test your settings on simulator (rather than on real account directly), or contact for personalized training around the SMI and its application situations.