
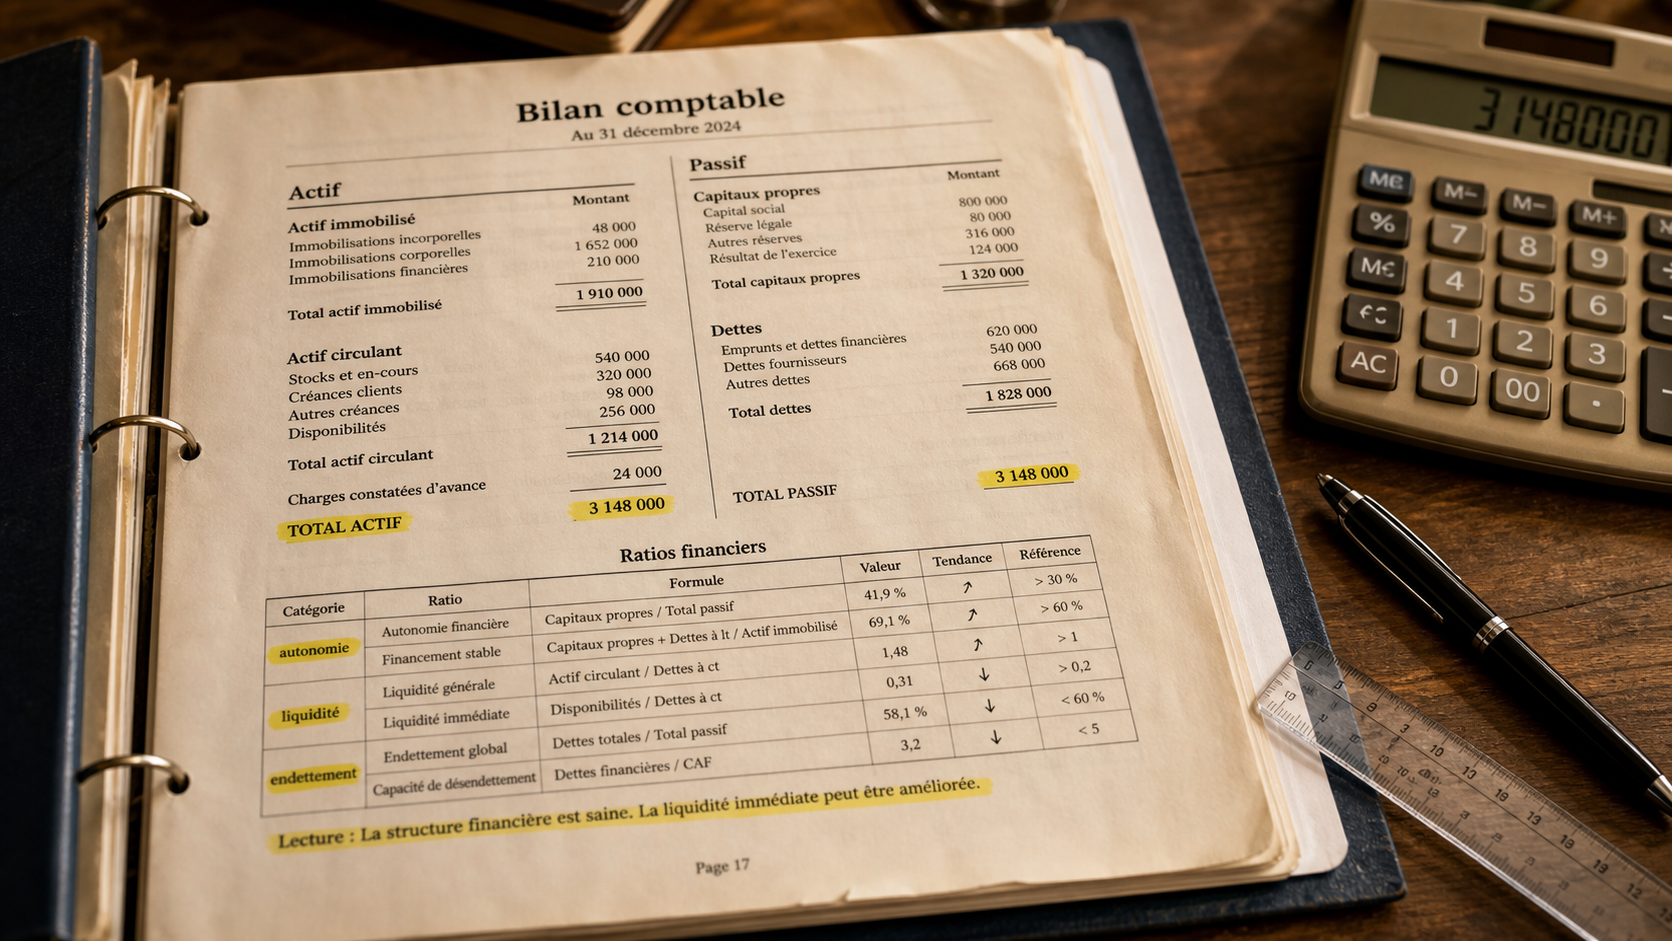

The accounting balance sheet is often seen as an austere document, reserved for the experts of the figure. Yet it offers the most faithful photograph of a company's heritage at a given moment. Knowing how to analyse is a strategic lever for any manager, investor or trading partner wishing to verify the financial strength of a structure.
To understand this document, it is not enough to read columns of figures. The aim is to decode the balance between what the company owns and what it needs. This guide breaks down the structure of the balance sheet, explains its various items and details the Financial ratios essential for transforming raw data into decision-making information.
Demystify the structure: the balance between Assets and Liabilities
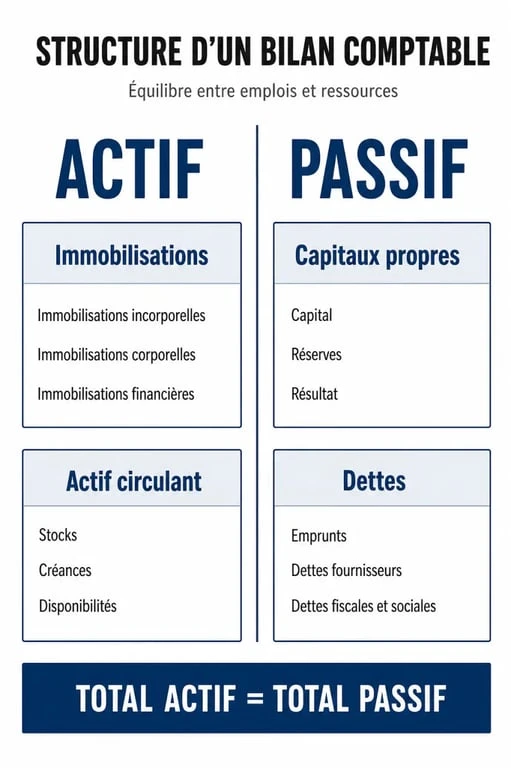
The basic principle of the balance sheet is perfect equality: the total assets must always be equal to the total liabilities. This equality reflects a simple economic reality: everything the company owns (the asset) was financed by a corresponding resource (the liability).
Active: Inventory of possessions
Active reads from top to bottom, according to an increasing liquidity criterion. At the top are the elements intended to remain in the company, at the bottom are those which circulate quickly.
Fixed assets group of sustainable investments: intangible capital assets (patents, commercial funds), tangible assets (machines, buildings) and financial assets (equity securities). Current assets brings together elements related to the operating cycle: inventory of goods, receivables and bank availability.
Liabilities: source of funds
The liability details the origin of the money used to acquire the assets. It is classified in order of duty, according to the repayment period.
Equity the company's foundation: social capital, reserves and profit and loss of the year. Debt This funding is supplemented by financial (bank borrowing) or operating (supplier, tax and social) debts.
The method of reading: from the observation to the interpretation
A relevant analysis begins with a comparative reading. An isolated balance sheet gives a fixed picture, but compared to the previous exercise (N-1) reveals a dynamic. If fixed assets increase sharply while turnover stagnates, the company may have overinvested without immediate return.
View the balance sheet as a flow matrix where each post is interconnected. This vision allows us to understand how an asset decision, such as the purchase of new equipment, impacts the structure of the liability, for example through a new loan or a fall in cash flow. This approach helps identify whether growth is healthy or is based on an imbalance between investment and financing capacities.
Analysis of working capital and cash flow
The first reflex is whether stable (capital) jobs are financed by stable resources (equity and long-term borrowing). It's the Global Net Rolling Fund (FRNG). If positive, the company has a safety margin. If it is negative, it finances its heavy investments with short-term debts, a risky situation.
The Cash Nette is the justice of the peace. It is calculated by subtracting the Rolling Fund Requirement (BFR) from the FRNG. Positive cash flow means that the company can meet its immediate maturities without resorting to bank overdrafts.
The 3 essential financial ratios
Using ratios compares the company with its competitors or industry standards. The following are the three most revealing indicators of health in a review.
| Ratio | Method of calculation | Interpretation |
|---|---|---|
| Financial autonomy | Own capital / Total balance sheet | Measure dependence on banks. Ideally above 20-25%. |
| General liquidity | Current assets / Short-term debts | Ability to pay debts with inventory and receivables. Must be > 1. |
| (Gearing) | Financial debt/equity | Assess the debt burden. Ideally < 1. |
Solvency ratio: survival insurance
Solvency measures the company's ability to pay its debts in full by selling its assets. A business can be profitable but insolvent if its assets lose value or its debts become too heavy. One ratio of financial autonomy It is often a sign of prudent management and great strategic freedom.
The liquidity ratio: the resistance test
The general liquidity ratio indicates whether the company can honour its supplier invoices and social security contributions. If this ratio falls below 1, the circulating asset is not sufficient to cover debts at less than one year. It is a warning signal that requires a renegotiation of payment deadlines or a cash contribution.
Identify alert signals
The analysis of a balance sheet is an investigation to detect frailties hidden behind balanced figures. Some positions deserve special attention.
Weight of receivables and inventories
A high circulating asset can be misleading. If the post Accounts receivable increase from one year to the next without a proportional increase in activity, the company may be struggling to get paid. Similarly, a stock that inflates abnormally often indicates obsolete or unsold products that will have to be depreciated, thus weighing on future results.
Erosion of equity
Equity is the security cushion. If they become less than half the share capital as a result of successive losses, the company is in a fragile legal situation. A fine analysis must check whether the net income reinforces these capital or whether it is systematically absorbed by previous losses. Without Solid equity, borrowing capacity becomes virtually nil, blocking any development perspective.
Analyzing an accounting balance sheet requires the method and the regression. By checking the overall balance, then diving into liquidity and solvency ratios, you will get a clear vision of the viability of a project. The report tells the story of how a company turns its resources into sustainable wealth.