


Discover how it workscompound interest This principle allows each euro placed to generate interests, which themselves become sources of return over the years. Let it be on a booklet A, life insurance or an ETF, acting with patience and constancy turns your starting contribution into increasing gains, thanks to a mathematical logic as simple as effective.
This guide demystifies compound interest, giving keys to anticipate, compare your investments and refine your choices, with examples and a simulator accessible to all.
Summary of key points
- ✅ Composite interest earns interest on accrued interest.
- ✅ Patience and consistency significantly enhance long-term performance.
- ✅ This guide provides examples and a simulator to better understand and apply the principle.
Calculate the compound interest in 60 seconds: explanation, example and turnkey simulator
Would you like to measure what your money really can produce, whether it rests "quietly" on an A booklet or is invested in an ETF? It is the famous snowball effect: each euro of interest generates interest over time – and the result becomes bluffing over 10, 20, or even 30 years.
It is relatively worth testing the calculation for your own situation via the simulator below, then to observe in detail how it all works... No complicated jargon.
Simulator of compound interest: project your gains in real time
Indicate your starting capital, regular payment, annual rate and desired duration. In seconds, measure the effect of compound interest on your long-term savings or investment!
Some examples:
• An investment of 5,000 € at 4%/year for about 20 years (without other payments) gives a final capital of about 10,961 €.
• An investment of 10,000 € plus 200 €/month at 6%/year over 25 years is equivalent to a final capital of about 187,650 €of which: 117 650 € interest earned.
How does compound interest work?

Imagine putting a little snowball on top of a hill. At each stage, it grows by attracting more snow around it... Composite interest is close: your interests make new interests, and it takes time to grow.
But in practice, what does this mean in the face of simple interest? Let's look at what's changing together.
Simple interest vs. compound interest: the click with a visual example
With simple interest, you receive the same amount each year, calculated on the initial capital. Conversely, in compound interest, each euro of interest joins the capital and is then yield generator.
For a better vision:
| Year | Interest Simple (1000€, 5%) | Compound interest (1000€, 5%) |
|---|---|---|
| 1 | 1 050 € | 1 050 € |
| 5 | 1 250 € | 1 276 € |
| 10 | 1 500 € | 1 629 € |
| 20 | 2 000 € | 2 653 € |
Over a period of 20 years, 1000 € 5 % reported 2653 € in compound interest, as against 2000 € in simple interest. The difference: +653 € Thanks to time, no extra effort!
Is that really clear? Accumulation is not linear, it accelerates. Some savers recognize that they only realize the gap by simulating over a long period: it is regularly observed that starting early makes it much less difficult to build capital.
The calculation formula and its decrypted variables
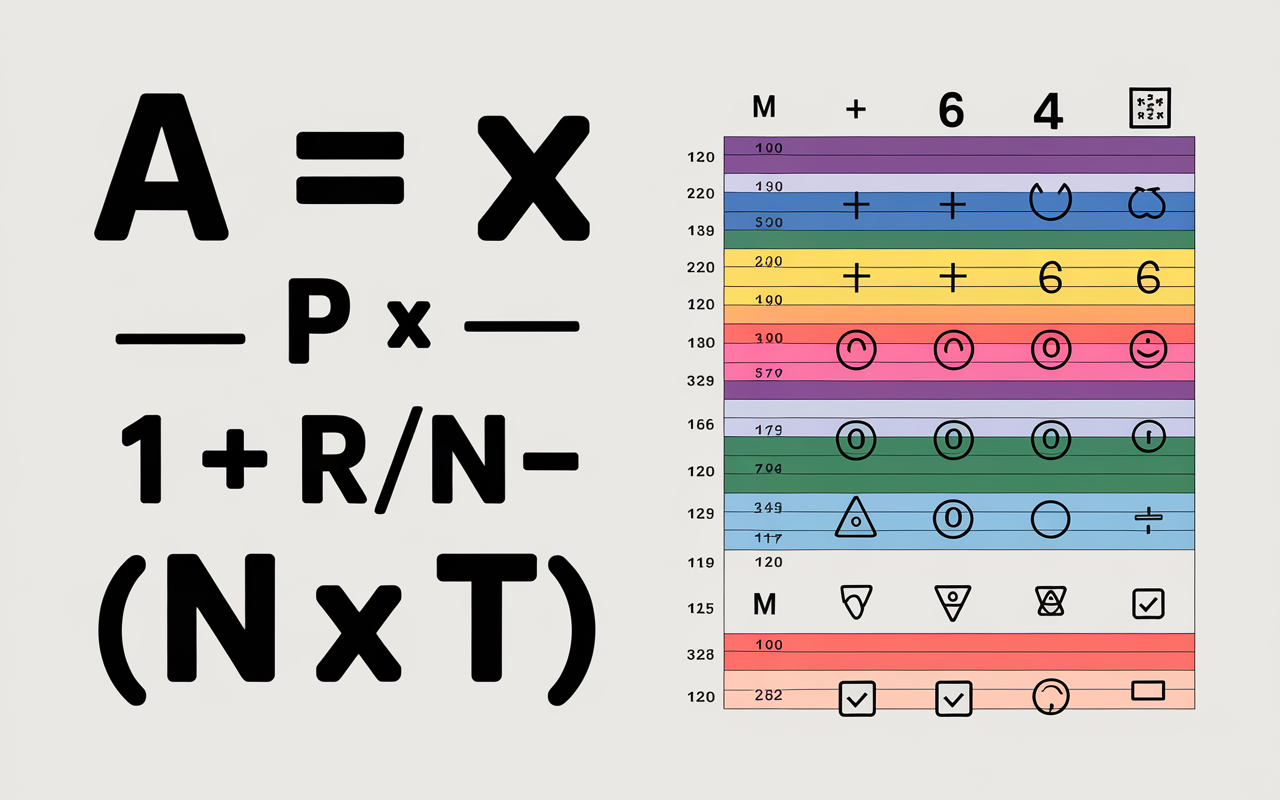
Does the formula sometimes look impressive? In reality, what we are holding back is its impact on your heritage. Out of curiosity or to prepare a review, here is a complete presentation, as well as variants adapted to monthly or quarterly payments.
The basic formula in simple language
Central compound interest formula (cases without new payments):
A = P × (1 + r/n)^(n×t)
A: final capital after interest, P: initial capital.
rAnnual rate expressed as decimal (e.g. 5% = 0.05).
nNumber of capitalizations per year (1 per year, 12 per month).
tTotal number of years.
Other points to note: more n is high (monthly, quarterly...), the greater the gain... even if the rate remains the same.
Let's see a concrete example: for 10,000 € invested at 4% for 10 years, with annual composition:
A = 10,000 × (1 + 0.04/1)^(1×10) = 10,000 × (1.04)^10 €
Either 4 802 € cumulative interest.
If you want to add regular (monthly) payments, the Excel feature to prefer is FV (Future Value). Many online simulators use directly.
Decryption of variables (general case and monthly payment, DCA...)
When you make monthly payments, a variant of the formula or the following Excel/Sheets function is used:
=FV(taux_période, nb_périodes, -versement, -capital_init, 0)
Here is a quick explanation of the parameters:
- period rate: calculated by dividing the annual rate by the number of periods per year, for example 6 %/12 = 0.5 % per month
- nb periods: number of years multiplied by 12 for a monthly payment – this is what makes all the difference over the duration
- Payment: the amount added each month (previously a negative sign so that the flow is properly taken into account by Excel)
- capital init: starting amount, also preceded by an "-" for Excel
Some professionals suggest that on most simulators, simply fill in the fields to get a complete projection: cumulative interests, sometimes graphic; This is also why time savings are significant.
Good to know
I recommend that you always integrate monthly payments, fees and taxes into your simulations to get realistic projections.
Calculate the compound interest in practice (examples, Excel, simulator)
Nothing is like a situation to capture the compound effect. Calculate yourself? It is feasible by following a step by step method. Some prefer Excel or simulator; These tools can be used to identify the levers to activate and maximize performance.
Practical example: how to calculate by hand
Let's imagine Arthur, who puts 2 000 € on an account 3 % per year, during 8 years, with annual capitalization.
The formula becomes:
A = 2,000 × (1 + 0.03)^8 €
Arthur finds a total of 534 € interest... without complex strategy or risk taking. A trainer recently mentioned that this type of calculation better anticipates results over several years.
Excel/Google Sheets case: express tutorial + model
In an Excel cell, for example, enter:=FV(3%/1;8;0;-2000;0)
The same result will appear (add your payments in the 3rd parameter if needed). It is often recommended to download a ready-to-use template to specialized sites or to Bank de France to simplify the task.
Summary table of popular examples
Observe how the result varies simply by changing the rate, duration or amount of savings/investment:
| Situation | Departure (€) | Payment/month (€) | Duration (years) | Rate (%) | Final capital (€) |
|---|---|---|---|---|---|
| Book A | 5 000 | 0 | 15 | 3 | 7 823 |
| Life insurance funds euro | 10 000 | 150 | 20 | 2,5 | 58 837 |
| ETF World (DCA) | 0 | 300 | 25 | 7 | 243 000 |
| Individual PER | 30 000 | 200 | 25 | 5,5 | 199 800 |
To be retained: place 200 €6 % month on 30 years can pass the final capital beyond 200 000 €, while the cumulative payments amount to 72 000 €. Interests "work"... and much more than your own payments. Some also note that this effect is often underestimated at the beginning.
Optimize and understand hidden traps
Simulators sometimes have impressive gains, but it's better to know about classic mistakes, bank charges, inflation and taxation before starting. A little attention to smoothing out the disappointments... and not be seduced by false promises.
Optimization factors and pitfalls to avoid
The duration counts enormously (time remains your best ally), the frequency of capitalisation (monthly more effective than annual), and also the less visible aspects: management costs on life insurance (of 0.6-2 %/year), taxes (flat tax 30%)... In some cases, the cost of 1 %/year during 20 years reduce the result by tens of thousands of euros.
Some elements to be monitored:
- Inflation: 4 % may be reduced to 1 % net If inflation exceeds 3% (this phenomenon has been common since 2022/2023 after INSEE).
- Volatility: on the stock exchange or crypto, years of decline slow growth (according to some experts, the ETF World shows 7-8 %/year net of inflation on average over a century... but the amount varies greatly from year to year!)
- Calculating problems: Always include all fees, monthly payments and taxes in your simulations to avoid bad surprises.
Emotion can play tricks: it happens that an investor withdraws everything after a difficult month, while long-term regularity is almost always more paying. Is it easy in reality? It is not always obvious, but calm management often maximizes this positive effect.
Frequently Asked Questions (FAQs)
Frequently asked questions about the calculation of compound interest, accompanied by precise and short answers, inspired by user feedback and concrete situations.
What is the difference between simple interest and compound interest?
The single interest gives each year a fixed amount, calculated on the starting capital (ex: 50 € per year per 1000 € 5 per cent. The compound interest adds interest to the capital each year, which broadens the base and accelerates yield. In practice, after 10 years of dynamic investment, the gap may exceed a range of 20 to 40 %.
How to calculate compound interest on Excel or Google Sheets?
The formula to be used: =FV(taux_période, nb_périodes, -versement, -capital). Example: for 100 €4 % month on 15 years :=FV(4%/12 ; 15*12 ; -100 ; 0)
Is the effect of quarterly or monthly capitalization really so strong?
It is often impressive: a bank offering monthly rather than annual capitalisation makes several hundred or even thousands of euros more available on 20 or 30 years. The higher the capitalization frequency, the more the snowball effect amplifies the difference with the simple interest.
Does this calculation work for Book A, life insurance, PERs or crypto?
Yes, the logic remains the same (although on Book A or on the Stock Exchange, the rate is subject to change). It should be added that for crypto or shares, it is better to take into account high volatility: returns are never guaranteed, and some professionals believe that caution is crucial on these media.
Does inflation really reduce my gain?
In practice, inflation plays a major role over time. With inflation of 3,5 %, an investment in 5 % produces only about 1.5 % per year in real terms. It is often recommended to introduce an inflation hypothesis in simulations!
Are there ready or free Excel templates?
Yes, the Bank of France, some brokers or specialized sites offer free models and simulators. Try looking for "Composite Interest Calculator Excel Banque de France" or visit the online simulator of Boursorama or Investopedia FR to test your own savings or investment scenarios.
To go further:
- Boursorama: complete guide and simulator
- Investopedia (FR): calculator and detailed explanations
- Bank of France Examples, models, good practices
⚠️ Past performance does not prejudge future results. Ask a professional for advice before any investment decision; simulations are indicative: always integrate fresh, inflation and taxation to get realistic projections!